Data for figure a were obtained
by conventional negative staining of isolated enzyme complexes, combined
with immunoelectron microscopic epitope mapping with subunit-specific IgG
antibodies (direct visualization of the antibodies without colloidal gold).
Data for figure b were obtained
by evaluation of electron micrographs of 2 D crystals of the enzyme grown
on the support film and metal shadowed. Data for figures c and d
were obtained by a combination of electron microscopic data and X-ray diffraction
studies.
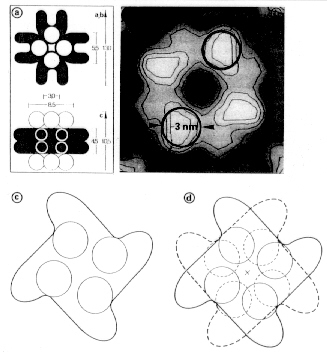
a, working model of the enzyme
complex. The large subunits (LSU) are black and the small subunits (SSU)
are white. All dimensions are given in nm.
b, 4-fold symmetrized imaged
sum (average of 300 aligned unit cells) obtained after metal shadowing.
A surface relief of one molecule viewed down the c-axis is depicted. Two
of the four masses representing SSUs are encirceled.
c, schematic drawing showing
one L4S4-half of the molecule (circles correspond to the SSUs)
d, two unstaggered face-to-face
L4S4-halves comprising the complete molecule (compare with a). (From Holzenburg,
A., Mayer, F., 1989, Electron Microsc. Rev. 2, 139-169; additional
references therein).