
Francisco Welter-Schultes
Zoologisches Institut der Universität
Berliner Str. 28
D-37073
Göttingen, Germany
E-mail:
![]()
.
Homepage
History, island area and habitat availability determine land snail species richness of Aegean islands
by WELTER-SCHULTES, F. W. & WILLIAMS, M. R. (1999)
This paper was published in the Journal of Biogeography. I am the first author of the paper and have no reprints any more. Because this paper is frequently requested, I decided to create this internet file.
Last modified 1.10.2002.
|
Francisco Welter-Schultes
|
E-mail:
|
.
WELTER-SCHULTES, F. W. & WILLIAMS, M. R. (1999): History, island area and habitat availability determine land snail species richness of Aegean islands. -- Journal of Biogeography 26 (2): 239-249. |
.
This is the text of this paper. Figures are below.
.
History, island area and habitat availability determine land snail species richness of Aegean islands
F. W. WELTER-SCHULTES1 and M. R. WILLIAMS2
1Institut für Zoologie und Anthropologie
der Universität, Berliner Str. 28, D-37073 Göttingen, Germany
2Biometrics Unit, Science and Information Division,
Department of Conservation and Land Management, 50 Hayman Road, Como WA 6152,
Australia
Short running title: Species-area relations of Aegean land
snails
Abstract. We examined the species-area relations of land snails
on 65 islands of the Aegean archipelago (Greece). The single most important
factor determining land snail species number was area. While colonization-extinction
dynamics have frequently been cited to explain this result, this conclusion
was not tenable in this study as it was contradicted by species number not being
related to the islands' distances to neighbouring larger islands, after accounting
for other factors affecting species number. We conclude that the snail fauna
of the Aegean is relictual, not equilibrial.
The unusually high number of land snail species found on Crete is consistent
with this conclusion. Crete is a currently united island which was separated
into at least six smaller islands for 7-9 million years during the Neogene.
Our results are consistent with the hypothesis that Crete still hosts a large
number of endemic species of these paleoislands, resulting in a total number
of species in excess of what would be expected based on area alone.
We also found that habitat diversity affected species richness even after accounting
for the effects of area: both increased elevation and greater extent of calcareous
substrate on islands resulted in higher species number. This effect was most
likely due to the fact that particular ecological conditions increased the probability
that particular species could survive on an island.
Finally, we compared the utility of the power and extreme-value function models
of the species-area relation and found that both gave substantially the same
results. However, fitting the power function model using non-linear regression
was of questionable utility.
Résumé. Nous avons examiné la relation d'espèce-superficie
de mollusques terrestres de 65 îles de l'archipel égéen
(Grèce). Le facteur le plus important déterminant le nombre d'espèces
était la superficie. Tandis que la dynamique de colonisation-extinction
a été fréquemment citée pour expliquer ce résultat,
cette conclusion n'était pas tenable dans cette étude car elle
a été contredite par le nombre d'espèces n'étant
pas lié aux distances des îles vers de plus grandes îles
voisines, après avoir déduit les effets d'autres facteurs affectant
le nombre d'espèces. Nous concluons que la faune de mollusques terrestres
de l'Égée est relictuale, non équilibriale.
Le nombre exceptionnellement élevé d'espèces de mollusques
terrestres de Crète est en accord avec cette conclusion. Crète
est une île actuellement unie qui était séparée dans
au moins six plus petites îles pour une période de 7-9 millions
d'années pendant le néogène. Nos résultats sont
conformes à l'hypothèse que Crète accueille toujours un
grand nombre d'espèces endémiques de ces paléoîles,
ayant pour résultat un nombre total d'espèces au-dessus de ce
qui serait prévu étant basé seulement sur la superficie.
Nous avons également constaté que la diversité d'habitats
a affecté la richesse d'espèces même après avoir
soustrait les effets de la superficie: la plus grande altitude et la plus grande
superficie du substrat calcaire sur des îles ont eu comme conséquence
un nombre plus élevé d'espèces. Cet effet était
très probablement dû au fait que les conditions écologiques
particulières augmentent la probabilité que l'espèce particulière
pourrait survivre sur une île.
Finalement nous avons comparé l'utilité des modèles de
fonction de puissance et d'extrême-valeur de la relation d'espèce-superficie
et avons constaté que tous les deux ont donné sensiblement les
mêmes résultats. Cependant, appliquant la régression non
linéaire dans le modèle de fonction de puissance était
d'une utilité incertaine.
Key words: Land snails, Greece, island biogeography, power function, extreme-value
function
Introduction
The species-area relation has been studied intensively over the past four
decades and reviews of the many different approaches to analysing island species-area
data may be found in Gilbert (1980) and Williams (1995). The dynamic equilibrium
theory of island biogeography (MacArthur & Wilson, 1967) postulates that
the effect of island area on species number is due to an equilibrium between
immigration and extinction. In many of the most important studies, birds or
flying insects have been used (e.g. Slud, 1976; Jaenike, 1978; Abbott, 1978;
Boecklen, 1986; Hanski & Gyllenberg, 1997). Because birds behave differently
to other organisms, the use of birds as "reference organisms" in species-area
studies has been questioned (Gilbert, 1980). One question that remains unresolved
is the effect of habitat diversity on species number. MacArthur & Wilson
(1967) stated that the use of area alone is misleading. They envisaged that
the area effect acts by increasing the number of habitats, and thus area acts
as a surrogate variable. In the decades that followed, many studies were carried
out to test this theory. Most of these studies rejected any effect of habitat
diversity on species richness (Simberloff, 1976; Abbott, 1978; Nilsson, Bengtsson
& Ås, 1988), others did not (Boecklen, 1986; Kohn & Walsh, 1994).
A further complicating factor in all species-area studies is the methods used
to fit the species-area model. Originally proposed by Arrhenius (see references
in Arrhenius, 1921), the power function model S = cAz has dominated studies
of the species-area relationship since its endorsement by Preston (1962, see
Tokeshi, 1993). Widespread use of the power function model, and the many empirical
studies that appear to fit this model, have led to its almost routine use in
studies of island biogeography. This is in contrast to the findings of Connor
& McCoy (1979) who concluded that the power function model is merely a computationally
convenient method of fitting a curve and has been applied as an approximation
primarily because of its ability to fit observed data, despite some undesirable
properties. The problems of the power function model were discussed by Williams
(1995), who extended the pioneering work of Coleman (1981) and proposed the
cumulative extreme-value function (EVF) as an appropriate model of species incidence
and hence of the species-area relation. The EVF is a sigmoidal curve that is
very similar to the power function for values of S less than about 70% of the
size of the total species pool. Like the power function, the EVF adequately
fits species-area data, but it has two principal advantages. First, the EVF
is bounded, so predicted values of S cannot exceed the size of the source pool.
Second, the EVF is appropriate to the distribution of S, which is approximately
binomial and thus can take only non-negative integer values. The extreme-value
function model also accommodates samples with S = 0. However, the best-fit model
for a particular species-area curve can usually only be determined empirically
(Connor & McCoy, 1979). In other words, after decades of intensive study
of the species-area relationship we are still dealing with phenomenology.
Much interest has centered on the z-values produced from the power function
model. This is because it is has been thought to reflect the shape of the underlying
species abundance distribution and a value of around 0.26 has been equated with
the canonical lognormal distribution. The slopes of empirical studies often
fall in the range of 0.2-0.5 (0.262 in Preston (1962); 0.263 in MacArthur &
Wilson (1967)). For land snails recorded values have been 0.42 for the high
islands of the Western Indian Ocean (Peake, 1971); 0.27 and 0.37 for the Madeiran
archipelago (Cook, Jack & Pettitt, 1972; Waldén, 1984); 0.27 for
the Kikládes (Mylonas, 1982); 0.25 for the South Aegean Island Arc (Vardinoyannis,
1994). The question whether or not the value of z has any importance for ecological
communities remains unresolved (Tokeshi, 1993).
The Greek islands seem predestined for species-area studies. They are numerous
and generally old enough to ensure that they do not bear primary succession
faunas, as occur for example in uplift archipelagos (Valovirta, 1979). Land
snails also seem ideal objects for biogeographical studies, as they are strictly
resident organisms with extremely limited ability to actively disperse over
the sea. Although wind-borne dispersal of Greek land snails may occur in exceptional
circumstances (Kirchner, Krätzner & Welter-Schultes, 1997), natural
immigration and colonization rates for island land snails are relatively low.
The geological history of the Aegean archipelago during the past 15 million
years is an important factor in their biogeography (Sfenthourakis, 1996). Before
the Serravallian (12-14 Ma), the area between modern Crete and northern Greece
was much less extensive than at present and consisted of a continental environment
without marine ingressions (Kissel & Laj, 1988; Götz, 1996; Fig. 1A).
As a result of the collision between the Arabian and the Eurasian plate in the
Caucasus and eastern Anatolia, the Anatolian block started to move westwards
in the Serravallian, originating the southward extension of the Aegean plate
(Angelier, 1979; Angelier et al., 1982; Jacobshagen, 1986; Taymaz, Jackson &
McKenzie, 1991; Götz 1996). Massive marine ingressions in the northern
and southern Aegean followed during the lower Tortonian (11 Ma), resulting in
the separation of six or more islands in the region of present-day Crete. These
Cretan paleoislands were relatively stable during the following 7-9 M yr (Fig.
1B). Due to this long isolation time, the species' populations on the paleoislands
may have diverged sufficiently to become different species. For Albinaria, the
most speciose group of Cretan snails, range contractions are thought to have
resulted in subspeciation and speciation processes; non-adaptive radiation was
suggested as the principal source of diversification (Gittenberger, 1991; Schilthuizen,
1994). In the late Pliocene (4 Ma) the southern Aegean was submitted to tectonic
uplift as a result of subduction of the African oceanic lithosphere (Angelier,
1979; Angelier et al., 1982; Götz, 1996; Papazachos & Kiratzi, 1996).
The Cretan paleoislands were joined around 3-2 Ma (Angelier, 1981; Jacobshagen,
1986). At the same time, the Kikládes land mass was submerged. The present
islands of the Kikládes archipelago (Fig. 1C) represent the summits of
the mountains of the ancient paleomainland.
[INSERT FIG. 1A-C NEAR HERE]
Sixty-five Greek islands hosting 264 autochthonous land snail species were included in this study. Using these data, we tested two hypotheses about the number of species of land snails on islands in the Aegean archipelago: (i) that species number is independent of the distance of an island from the nearest large species pool; and (ii) that species number is greater on islands with more potential habitats. Hypothesis (i) tests whether island faunas are relictual or equilibrial and hypothesis (ii) tests whether area per se is sufficient to explain island species number. We also compared the results of using the power and EVF models of the species-area relation.
Materials and methods
The species number data for 26 small islands near Crete are based on collections
by F. Welter-Schultes, the results are published elsewhere. The data for the
central Aegean islands were taken from other literature sources. Fossil records
and records of shells of dead land snails that have sometimes been found at
island beaches were excluded. We analysed only the number of autochthonous species,
but also record the number of introduced species in the appendix. Fossil species
were not considered because the probability of finding fossil shells depends
upon: (i) the geological structure of the area, which in turn determines their
conservation probability, and (ii) on the abundance of the extinct species.
The area values for the small islands around Crete were determined from 1:200
000 maps (Ethnikí Statistikí Ipiresía tis Elládos,
1972) as some previously published values of area for the small Cretan islands
are inaccurate. The values for area, elevation and area of calcareous substrate
for the other islands were taken from various sources (see references in Table
1).
To assess the nature of any relationship between the area of calcareous substrate
and species number, four new variables were derived for each island: (i) the
proportion of the island comprised of calcareous substrate; (ii) whether calcareous
substrate was present on the island, and if so then: (iii) whether calcareous
substrate comprised all, or (iv) only part, of the total area of the island.
The rationale for including these latter three variables was to assess whether
the mere presence of a different habitat type would prove as important as the
extent of that habitat. Each of these conditional variables were coded as design
(or dummy) variables, set to 0 if the condition was false, or 1 if true. Design
variables of this kind are the standard approach to identifying the statistical
significance of such categorical variables (Hosmer & Lemeshow, 1989).
We tested the two hypotheses by stepwise regression analysis, using both the
power and EVF models. A stepwise approach was necessary because some factors,
such as the extent of calcareous areas, can only be examined after other related
factors, such as area, are accounted for. By identifying the factors affecting
species number sequentially, we identified only those variables that were still
important after the effects of other, more important factors had been accounted
for. To ensure that all variables important in affecting species number were
identified, we used a significance level of 0.15 for entering a variable into
the stepwise regression model and a significance level of 0.20 to retain the
variable. As the choice of these levels may be crucial to the outcome of a stepwise
regression procedure, the levels were set a priori to the values recommended
by Hosmer & Lemeshow (1989).
Results
No islands with fewer than four autochthonous species were found (Table 1). The smallest island where land snails have been found (Petallídi) has an area of 0.0058 km2, but only approximately 0.0016 km2 of this serves as habitat for land snails (Schultes & Wiese, 1990). Slightly smaller "islands" than Petallídi have been examined north of Gávdos, but no snails were found. Land snails are probably unable to survive there because of the disturbances caused by the sea in stormy weather conditions. It is therefore unlikely that land snails persist on any Greek rocks in the sea smaller than 0.001 km2. These rocks are not considered as islands in this study.
Species-area relations
The fit of the extreme-value and power functions to area alone data was comparable (Table 2). Using non-linear regression to fit the power function model, as suggested by Wright (1981), gave the highest value of R2 (Fig. 2) but this method resulted in systematic lack of fit at small areas. Non-linear regression cannot be used for constructing multiple regression models, so we did not proceed with this method to examine other factors affecting fit. The EVF gave better fit than the power function at large areas, but worse fit at small areas (Fig. 2). Some of this lack of fit may be attributable to other factors, which were examined in the subsequent stepwise regression analysis.
The largest island included in the analyses was Crete. For comparative purposes, we have included Albania, Former Yugoslavia, Europe and the western Mediterranean islands of Sicily, Sardinia and Corsica in figures, but not in any regression models. We did not add values for Turkey presented in Schütt (1993) due to the poor reliability of these data (Hausdorf, 1994, F. Welter-Schultes, unpublished data). Area and island elevation were identified as the most important factors affecting species number (Table 2, parameter estimates for each model are given in Table 3). The proportion of the island composed of calcareous substrate was identified as the next most important factor. After accounting for these factors, distance to the next considerably larger island was not identified as of any statistical importance in affecting species number.
Discussion
Error sources
Slugs and species of the small or cryptic genera Truncatellina, Paralaoma
(= Toltecia), Cecilioides and Vitrea could live on additional islands, including
some smaller ones, the species numbers of which may subsequently prove to be
1-3 species higher. In a few cases it is difficult to distinguish autochthonous
from introduced species (e.g. Oxychilus cyprius (Pfeiffer), see Riedel, 1992;
Deroceras reticulatum (Müller), see Wiktor, 1996). The occurrence of three
Metafruticicola species on Elása (Martens, 1889) is yet to be verified.
However, these potential sources of error should not substantially affect the
results of this study. The island species numbers of land snails in the Aegean
are known with substantially more confidence than the best-known major Pacific
archipelago, Hawaii (Cowie, 1995).
On some islands (including uninhabited ones), human activities such as goat
rearing and burning practises may have caused extinction of a few species. Their
number is considerably lower than in tropical archipelagos (for Hawaii see Cowie,
1995) and is not expected to have any substantial influence on the species numbers.
The area values are based on two-dimensional map projections that do not incorporate
the island relief, a factor which may considerably enlarge the habitable area
for land snails. Coastal rocks are not habitable by land snails, although they
are included in the area values. This error is likely to be substantial only
at very small areas. Many metamorphic or ophiolitic formations were counted
as "non-calcareous" although they contain CaCO3 in small percentages
(Vicente, 1970).
Species-area relations
Island area and elevation accounted for most variability in species number
(Table 2). The increased number of species associated with higher island elevations
may indicate that increased numbers of potential habitats increases species
number. Higher islands typically contain a greater range of potential habitats,
and so are habitat-rich relative to low islands of the same area.
Island species number is influenced by the increased number of habitats associated
with increasing island elevation and increased extent of calcareous substrate.
This leads to the conclusion that there are species which cannot survive on
non-calcareous substrate, but few or no species unable to live on calcareous
substrate.
In terms of our initial hypotheses, we conclude that these land snail faunas
are predominantly relictual. The species number of Crete (120 autochthonous
species, F. Welter-Schultes, unpublished data) is much higher than would be
expected from its area alone, the predicted values being 50 (power function)
and 68 (EVF) (Fig. 2). This probably reflects the paleogeographic history of
Crete. Crete was divided into a number of smaller islands from the lower Tortonian
(11 Ma) to the late Pliocene (2 Ma). During this period of isolation, several
species evolved into different species on the paleoislands; this is particularly
apparent in certain groups such as Albinaria, Mastus and Xerocrassa. Today,
a high number of vicariant species are found in different regions of Crete,
presumably microendemics of the ancient paleoislands. The high species number
for Crete thus reinforces that the Aegean snails are relictual, not equilibrial.
Birds and flying insects, which are usually taken as reference examples for
equilibrial faunas (Slud, 1976; Boecklen, 1986; Hanski & Gyllenberg, 1997),
are not necessarily resident organisms. We may conclude that oceanic islands
do not provide effective isolation for flying organisms. As the effect of area
on species number is also observed in relictual land snails, where colonization
is reduced, colonization-extinction dynamics is not likely to be the only explanation
for the species-area relationship.
Comparison of models
The extreme-value and power function models gave almost identical results. The two models are comparable when the number of species is less than approximately 70% of the size of the source pool (Williams, 1995), so this had been anticipated. The systematic lack of fit of the power function when fitted by non-linear regression is attributable to the fact that in non-linear regression, the parameter estimates are too heavily influenced by large values. This fact was overlooked by Wright (1981) when he recommended non-linear regression. When combined with the inability of this type of non-linear method to address multiple regression problems, the value of non-linear regression in modelling species-area problems must be questioned.
Relation between Enidae species and area of Aegean islands
The Enidae (Pulmonata: Pupilloidea) of 63 Aegean islands were analysed by Heller (1976), resulting in no apparent species-area relationship at all (see also Gilbert, 1980). However, as Williams (1995) pointed out, species number is not a continuous, but rather a discrete, variable. This is one of the shortcomings of the power function model and must be considered when evaluating these data, where 53 of 63 islands have only one species and some have zero. Heller (1976) excluded islands with zero enid species, a potential source of bias in species-area studies (Williams, 1996). Mylonas (1982) found that for the Enidae, species number and area were related for a sample of 18 islands of the Kikládes (SEn = cA0.315). Of 24 islands that were thoroughly examined, 6 islands with zero Enidae were excluded from species-area relationship calculations; on a further 9 islands only one enid species was found. For the South Aegean Island Arc, the same procedure was followed by Vardinoyannis (1994) (SEn = cA0.173). However, nine of 13 islands examined had only one enid species. Enid land snails occur on 33 out of 36 examined islands of the South Aegean Island Arc (Table 1); on 29 of these islands the species number is one. We conclude that attempting to calculate a species-area relation for such data using the power function model is unlikely to lead to any biologically meaningful conclusions.
Autochthonous and introduced species
Presence of snail species on islands is assumed to be synonymous with residence, a fact which is usually implicit for species-area studies (Williams, 1995). A major problem with land snails in Greece is the high percentage of anthropochorous species that have been transported by humans to particular Aegean islands in historical times (Mylonas, 1982; Mylonas, 1984; Hausdorf, 1990; Riedel, 1992; Wiktor, Vardinoyannis & Mylonas, 1994; Welter-Schultes, 1998c). The number of introduced species is related to the island area in the same way as are the autochthonous species, only if the rate of introduction is equally related to island area; we may presume that this is not so. There seems little doubt that the probability of successfully introducing new species of land snails to a particular island is positively correlated with commercial attractiveness of the island. This in turn depends upon a variety of cultural and strategic factors. The number of introduced species thus reflects the history of Greece and the Aegean islands. This study was designed to examine natural phenomena, not the cultural history of the Eastern Mediterranean. Consequently, land snail species that had been introduced to particular islands were not considered. The introduced species usually did not cause extinctions of autochthonous species by competitive displacement (Mylonas, 1984).
Influence of habitat size
Surprisingly, islands with only 1-3 species apparently do not exist. Apart from one island with only four species (the non-calcareous island of Mikronísi where Albinaria and Metafruticicola are missing) the smallest three islands (Petallídi, Kaváli NW and Marmára, all smaller than 0.01 km2) host five autochthonous species. Two of them (Petallídi and Marmára) also host two introduced species each. We conclude that several species probably require an aproximately equally sized minimum viable population area. The size of this minimum area is probably near 0.0016 km2 for Mastus, Metafruticicola, Xerocrassa, Eobania, and the introduced Caracollina, Cochlicella, Theba and Helix. For Albinaria and Granopupa the minimum area is probably slightly larger (near 0.005 km2), as they do not occur on Petallídi.
Influence of habitat diversity
Habitat variability is not necessarily a sufficient explanation of the effect
of area on species number (Simberloff, 1976; Abbott, 1978). In a study on land
snails of 17 islands of Lake Mälaren, Sweden, the habitat diversity hypothesis
as an explanation for the species-area relation was rejected (Nilsson, Bengtsson
& Ås, 1988). However, presence and absence of particular habitat types
(habitat availability) may well be a function of island area. Kohn & Walsh
(1994) found that the direct effects of area and habitat diversity on plant
species richness of 65 islands off the Shetland mainland were roughly equal
in magnitude.
For the Aegean land snails, we found that species numbers were affected by both
area and habitat (calcareous substrate, elevation) effects. This agrees with
the findings of Boecklen (1986) and Kohn & Walsh (1994). Habitat availability
factors such as the occurrence of different vegetation types or the presence
of calcareous substrate could affect the number of species present. Some snails
(Rupestrella, Pyramidula, Zebrina stokesi) are unable to persist in non-calcareous
areas (Mylonas, 1982); conversely, all species are able to survive in calcareous
areas. The degree to which this affects total species number depends on the
relation between two factors: (i) the relation between total species number
and the number of species restricted to calcareous areas; and (ii) the number
of studied islands.
The following statements (Mylonas, 1982) provide evidence of the correlation
between habitat diversity and total species number, and hence, between habitat
diversity and species-area relation.
1. Rupestrella rhodia (Roth) is unable to survive in non-calcareous areas,
2. there are other Aegean land snails surviving in non-calcareous areas,
3. there is no Aegean land snail which is unable to survive in calcareous areas,
4. there are islands with calcareous areas and islands without calcareous areas.
As a logical consequence, the species number of non-calcareous islands will
typically be lower than the species number of calcareous islands, because at
least one species is unable to persist on the non-calcareous islands. Hence,
habitat diversity cannot be ignored in species-area studies, a result found
empirically in this study.
Summary
Habitat diversity or availability is an important determinant of species
number. It is therefore likely that present-day island species richness has
been determined by an interplay of habitat availability, historical effects
peculiar to each island, together with equilibrium dynamics. However, this study
rejects the equilibrium model as a principal or important cause of land snail
species richness on islands of the Aegean. Rather, habitat availability and
historical effects have been the major factors, but they have applied differentially
at different places to produce the current patterns of species richness.
There are many other factors that may affect the species numbers of particular
land snails, such as vegetation type, geology, erosion behaviour or the presence
of sandy beaches. For many Aegean land snails the effects of these factors are
as yet unknown. At least eight Aegean genera seem to need a minimum viable population
area of 0.0016 km2, two more genera 0.005 km2. Albinaria is strictly restricted
to calcareous rocky habitats (Welter-Schultes, in press), which explains its
absence from the island of Mikronísi. Further knowledge of the autecology
of the Aegean snails is needed in order to test the hypothesis that habitat
diversity acts indirectly on species number through presence and absence of
particular habitat types. This echoes the call by Abbott (1983) for more research
on ecological preferences of the species.
Acknowledgments
We are grateful to E. Gittenberger and G. Manganelli for help with particular data, and to I. Abbott, W. J. Boecklen and M. Schaefer for helpful comments on the manuscript.
References
Abbott, I. (1978) Factors determining the number of land bird species on
islands around South-Western Australia. Oecologia 33, 221-233.
Abbott, I. (1983) The meaning of z in species/area regressions and the study
of species turnover in island biogeography. Oikos 41, 385-390.
Angelier, J. (1979) Recent Quaternary tectonics in the Hellenic Arc: examples
of geological observations on land. Tectonophysics 52, 267-275.
Angelier, J. (1981) Analyse quantitative des relations entre déformation
horizontale et mouvements verticaux: l'extension égéenne, la subsidence
de la mer de Crète et la surrection de l'arc hellénique. Annales
de Géophysique 37 (2), 327-345.
Angelier, J., Lybéris, N., Le Pichon, X., Barrier, E. & Huchon, P.
(1982) The tectonic development of the Hellenic Arc and the Sea of Crete: a
synthesis. Tectonophysics 82, 159-196.
Arrhenius, O. (1921) Species and area. Journal of Ecology 9, 95-99.
Bank, R. A. (1988.) Die Molluskenfauna der griechischen Insel Lesbos (= Mytilini).
Basteria 52, 61-76.
Bar, Z. & Butot, L. J. M. (1986) The land snails of Chios. De Kreukel 22,
65-93.
Bodon, M., Favilli, L., Giannuzzi Savelli, R., Giovine, F., Giusti, F., Manganelli,
G., Melone, G., Oliverio, M., Sabelli, B. & Spada, G. (1995) Gastropoda
Prosobranchia, Heterobranchia Heterostropha. Checklist delle specie della fauna
italiana, 14 (eds. A. Minelli, S. Ruffo & S. La Posta), pp. 1-60. Edizioni
Calderini, Bologna.
Boecklen, W. J. (1986) Effects of habitat heterogeneity on the species-area
relationships of forest birds. Journal of Biogeography 13, 59-68.
Coleman, B. D. (1981) On random placement and species-area relations. Mathematical
Biosciences 54, 191-215.
Connor, E. F. & McCoy, E. D. (1979) The statistics and biology of the species-area
relationship. American Naturalist 113, 791-833.
Cook, L. M., Jack, T. & Pettitt, C. (1972) The distribution of land molluscs
in the Madeiran Archipelago. Boletim do Museu Municipal do Funchal 26, 5-30.
Cowie, R. H. (1995) Variation in species diversity and shell shape in Hawaiian
land snails - in situ speciation and ecological relationships. Evolution 49,
1191-1202.
Dhora, D. & Welter-Schultes, F. W. (1996) List of species and atlas of the
non-marine molluscs of Albania. Schriften zur Malakozoologie 9, 90-197.
Falkner, G. (1990) Binnenmollusken. Steinbachs Naturführer 10, 112-280.
Gilbert, F. S. (1980) The equilibrium theory of island biogeography: fact or
fiction? Journal of Biogeography 7, 209-235.
Gittenberger, E. (1991) What about non-adaptive radiation? Biological Journal
of the Linnean Society 43, 263-272.
Götz, L.-G. (1996) Beschreibung und Vergleich der Tektonik pazifischer
und mediterraner Backarc-Becken hergeleitet aus echographischen und bathymetrischen
Vermessungen. Berichte aus dem Zentrum für Meeres- und Klimaforschung,
Reihe c: Geophysik 9, 1-165.
Hanski, I. & Gyllenberg, M. (1997) Uniting two general patterns in the distribution
of species. Science 275, 397-400.
Hausdorf, B. (1990) Über die Verbreitung von Microxeromagna armillata (Lowe,
1852) und Xerotricha conspurcata (Draparnaud, 1801) in Griechenland und der
Türkei. Malakologische Abhandlungen 15, 55-62.
Hausdorf, B. (1994) Buchbesprechungen. Schütt, H. (1993): Türkische
Landschnecken. -- 433 S., zahlreiche Abbldungen. Wiesbaden (Hemmen). Mitteilungen
der Deutschen Malakozoologischen Gesellschaft 53, 47-48.
Heller, J. (1976) The biogeography of enid landsnails on the Aegean islands.
Journal of Biogeography, 3, 281-292.
Hosmer, D. W. & Lemeshow, S. (1989) Applied Logistic Regression. Wiley and
Sons, New York.
Jacobshagen, V. (1986) Geologie von Griechenland. Beiträge zur Regionalen
Geologie der Erde 19, 1-363, 2 geol. maps.
Jaenike, J. (1978) Effect of island area on Drosophila population densities.
Oecologia 36, 327-332.
Kirchner, C., Krätzner, R. & Welter-Schultes, F. W. (1997) Flying snails
- how far can Truncatellina (Pulmonata: Vertiginidae) be blown over the sea?
Journal of Molluscan Studies 63, 479-487.
Kissel, C. & Laj, C. (1988) The Tertiary geodynamical evolution of the Aegean
arc: a paleomagnetic reconstruction. Tectonophysics 146, 183-201.
Kohn, D. D. & Walsh, D. M. (1994) Plant species richness - the effect of
island size and habitat diversity. Journal of Ecology 82, 367-377.
MacArthur, R. H. & Wilson, E. O. (1967) The theory of island biogeography.
Princeton University Press, Princeton.
Manganelli, G., Bodon, M., Favilli, L. & Giusti, F. (1995) Gastropoda Pulmonata.
Checklist delle specie della fauna italiana, 16 (eds. A. Minelli, S. Ruffo &
S. La Posta), pp. 1-60. Edizioni Calderini, Bologna.
Martens, E. von (1889) Griechische Mollusken gesammelt von Eberh. von Örtzen.
Archiv für Naturgeschichte 55 (1) (2), 169-240, Tafeln 9-11.
Mylonas, M. A. (1982) Meléti páno sti zoogeografía ke ikología
ton cherséon malakíon ton Kikládon. [The zoogeography and
ecology of the terrestrial molluscs of Cyclades]. Unpublished Ph. D thesis,
University of Athens.
Mylonas, M. (1984) The influence of man: a special problem in the study of the
zoogeography of terrestrial molluscs in the Aegean islands. World wide snails.
Biogeographical studies on non-marine Mollusca (eds. A. Solem & A. C. van
Bruggen), pp. 249-259. Brill/Backhuys, Leiden.
Mylonas, M. & Vardinoyannis, K. (1989) Contribution to the knowledge of
the terrestrial malacofauna of Macronissos Island (Cyclades, Greece). Journal
of Conchology 33, 159-164.
Nilsson, S. G., Bengtsson, J. & Ås, S. (1988) Habitat diversity or
area per se? Species richness of woody plants, carabid beetles and land snails
on islands. Journal of Animal Ecology 57, 685-704.
Papazachos, C. B. & Kiratzi, A. A. (1996) A detailed study of the active
crustal deformation in the Aegean and surrounding area. Tectonophysics 253,
129-153.
Peake, J. (1971) The evolution of terrestrial faunas in the western Indian Ocean.
Philosophical Transactions of the Royal Society of London, Series B, Biological
Sciences 260, 581-610.
Piantelli, F., Giusti, F., Bernini, F. & Manganelli, G. (1990) The mollusc
and oribatid fauna of the Aeolian and Tuscan archipelagos and the island equilibrium
theory. Atti dei Convegni Lincei 85, 117-154.
Preston, F. W. (1962). The canonical distribution of commonness and rarity.
Ecology 43, 185-215 and 410-432.
Reischütz, P. L. (1985) Ein Beitrag zur Molluskenfauna von Léros
(Dodekanes, Griechenland). Malakologische Abhandlungen 11, 17-24.
Reischütz, P. L. (1986) Beiträge zur Molluskenfauna der ägäischen
Inseln. Malakologische Abhandlungen 11, 93-103.
Riedel, A. (1992) The Zonitidae (sensu lato) (Gastropoda, Pulmonata) of Greece.
Fauna Graeciae 5, 1-194.
Schilthuizen, M. (1994) Differentiation and hybridisation in a polytypic snail.
PhD Thesis, University of Leiden.
Schultes, W. & Wiese, V. (1990) Die Gattung Albinaria auf Kreta: IV. Zur
Verbreitung der Landschnecken auf Día. Schriften zur Malakozoologie 3,
23-47.
Schultes, W. & Wiese, V. (1991) Die Gattung Albinaria auf Kreta: VII. Die
Landschneckenfauna der Dionisádes-Inseln. Schriften zur Malakozoologie
4, 76-93.
Schultes, W. & Wiese, V. (1992) Die Gattung Albinaria auf Kreta: IX. Landschnecken
einiger ostkretischer Nebeninseln. Schriften zur Malakozoologie 5, 73-77.
Schütt, H. (1993) Türkische Landschnecken. Christa Hemmen Verlag,
Wiesbaden.
Sfenthourakis, S. (1996) A biogeographical analysis of terrestrial isopods (Isopoda,
Oniscidea) from the central Aegean islands (Greece). Journal of Biogeography
23, 687-698.
Simberloff, D. (1976) Experimental zoogeography of islands: effects of island
size. Ecology 57, 629-648.
Slud, P. (1976) Geographic and climatic relationships of avifaunas with special
reference to comparative distribution in the Neotropics. Smithsonian Contributions
to Zoology 212.
Taymaz, T., Jackson, J. & McKenzie, D. (1991) Active tectonics of the north
and central Aegean Sea. Geophysical Journal International 106, 433-490.
Tokeshi, M. (1993) Species abundance patterns and community structure. Advances
in Ecological Research 24, 111-186.
Vardinoyannis, K. (1994) Viogeografía ton cherséon malakíon
sto nótio nisiotikó egeakó tóxo [Biogeography of
land snails in the South Aegean Island Arc]. Unpublished Ph. D. thesis, University
of Athens.
Valovirta, I. (1979) Primary succession of land molluscs in an uplift archipelago
of the Baltic. Malacologia 18, 169-176.
Vicente, J.-C. (1970) Étude géologique de l'île de Gávdos
(Grèce), la plus méridionale de l'Europe. Bulletin de la Société
Géologique de France (7) 12 (3), 481-494.
Waldén, H. W. (1984) On the origin, affinities, and evolution of the
land Mollusca of the Mid-Atlantic Islands, with special reference to Madeira.
Boletim do Museu Municipal do Funchal 36, 51-52.
Welter-Schultes, F. W. (1998a) Albinaria land snails in central and eastern
Crete: distribution map of the species (Gastropoda: Clausiliidae). Journal of
Molluscan Studies 64, 275-279.
Welter-Schultes, F. W. (1998b) Die Landschnecken der griechischen Insel Gávdos,
der südlichsten Insel Europas. Schriften zur Malakozoologie 12, 1-120.
Welter-Schultes, F. W. (1998c) Human-dispersed land snails in Crete, with special
reference to Albinaria (Gastropoda: Clausiliidae). Biologia Gallo-hellenica
24, 83-106.
Welter-Schultes, F. W. & Wiese, V. (1993) Die Gattung Albinaria auf Kreta:
X. Die Landschneckenfauna der Paximádia-Inseln vor Südkreta (Nómos
Rethimnís). Schriften zur Malakozoologie 6, 51-54.
Welter-Schultes, F. W. & Wiese, V. (1997a) Die Landschnecken der Grándes-Insel
westlich von Palékastro (Ostkreta). Schriften zur Malakozoologie 10,
61-63.
Welter-Schultes, F. W. & Wiese, V. (1997b) Die Landschnecken der Insel Chrisí
(südlich Kreta) und der Nebeninsel Mikronísi. Schriften zur Malakozoologie
10, 64-79.
Welter-Schultes, F. W. & Wiese, V. (1997c) Die Landschnecken der Insel Koufonísi
(südlich Kreta) mit Nebeninseln. Schriften zur Malakozoologie 10, 80-95.
Wiktor, A. (1996) The slugs of the Former Yugoslavia (Gastropoda terrestria
nuda: Arionidae, Milacidae, Agriolimacidae, Limacidae). Annales Zoologici 46,
1-110.
Wiktor, A., Vardinoyannis, K. & Mylonas, M. (1994) Slugs of the Greek Southern
Aegean Islands (Gastropoda terrestria nuda: Milacidae, Agriolimacidae et Limacidae).
Malakologische Abhandlungen 17, 1-36.
Williams, M. R. (1995) An extreme-value function model of the species incidence
and species-area relations. Ecology 76, 2607-2616.
Williams, M. R. (1996) Species-area curves: the need to include zeroes. Global
Ecology and Biogeography Letters 5, 91-93.
Wright, S. J. (1981) Intra-archipelago vertebrate distributions: the slope of
the species-area relation. American Naturalist 118, 726-748.
Table 1. Parameters for each of the 65 evaluated Aegean islands. Values for the western Mediterranean islands Sicily, Sardinia and Corsica and for continental regions are listed for comparison.
Island Region A Acal S Saut SEn Altitude NCLI D References
for S
or
territory [km2] [km2] [m
a.s.l.] [km]
1. Petallídi
(near Día) Crete 0.0058 0.0058 7 5 1 19 Día 1.15 Schultes
& Wiese, 1990
2. Kaváli
(NW) Crete 0.0066 0.0066 5 5 0 24 Crete 0.59 Schultes
& Wiese, 1992
3. Marmára
(Koufonísi) Crete 0.0077 0.0077 7 5 1 10 Koufonísi 0.12 Welter-Schultes
& Wiese, 1997c
4. Kaváli
(E) Crete 0.020 0.020 7 5 0 47 Crete 0.62 Schultes
& Wiese, 1992
5. Kaváli
(SW) Crete 0.021 0.021 10 7 0 59 Crete 0.75 Schultes
& Wiese, 1992
6. Kimó Crete 0.026 0.026 6 5 1 11 Crete 0.20 Schultes
& Wiese, 1992
7. Kónida Crete 0.037 0.037 6 5 1 25 Crete 1.2 Schultes
& Wiese, 1992
8. Prásonísi
(Dionisádes) Crete 0.055 0.055 11 8 1 44 Dragonáda 0.15 Schultes
& Wiese, 1991
9. Makrouló
(Koufonísi) Crete 0.070 0.070 5 5 1 10 Koufonísi 0.35 Welter-Schultes
& Wiese, 1997c
10. Ag.
Nikólaos (Móchlos) Crete 0.073 0.073 13 11 1 62 Crete 0.30 Schultes
& Wiese, 1992
11. Mikronísi
(Chrisí) Crete 0.150 0.0 7 4 1 16 Chrisí 0.61 Welter-Schultes
& Wiese, 1997b
12. Strongiló
(Koufonísi) Crete 0.150 0.150 9 7 1 19 Koufonísi 0.68 Welter-Schultes
& Wiese, 1997c
13. Tráchilos
(Koufonísi) Crete 0.158 0.158 9 5 1 43 Koufonísi 0.18 Welter-Schultes
& Wiese, 1997c
14. Kolokíthia Crete 0.17 0.17 6 5 1 40 Crete 0.40 Schultes
& Wiese, 1992
15. Grándes Crete 0.28 0.28 10 7 1 42 Crete 1.45 Welter-Schultes
& Wiese, 1997a
16. Pondikonísi Crete 0.28 0.28 13 9 1 164 Crete 8.7 Vardinoyannis,
1994
17. Paximáda
(Dionisádes) Crete 0.32 0.32 7 7 1 133 Dragonáda 2.05 Schultes
& Wiese, 1991
18. Paximádia
(W) Crete 0.76 0.76 15 14 1 252 Crete 9.7 Welter-Schultes
& Wiese, 1993; Vardinoyannis, 1994
19. Paximádia
(E) Crete 0.80 0.80 12 11 1 166 Crete 9.1 Welter-Schultes
& Wiese, 1993
20. Agria
Gramvoúsa Crete 0.84 0.84 7 7 1 103 Crete 0.67 Vardinoyannis,
1994
21. Psíra Crete 1.50 1.50 12 10 1 204 Crete 2.3 Schultes
& Wiese, 1992
22. Elása Crete 1.75 1.75 ?
9 ? 8 1 72 Crete 2.55 Martens,
1889
23. Gianisáda
(Dionisádes) Crete 2.25 2.25 14 13 1 147 Crete 6.8 Schultes
& Wiese, 1991
24. Gavdopoúla Crete 2.75 2.75 14 12 1 133 Gávdos 7.3 Vardinoyannis,
1994; Welter-Schultes, 1998b
25. Dílos Kikládes 3.43 0.0 15 10 112 Míkonos 2.2 Mylonas,
1982
26. Dragonáda
(Dionisádes) Crete 3.05 3.05 10 9 1 128 Crete 8.3 Schultes
& Wiese, 1991
27. Koufonísi Crete 4.25 4.25 14 8 1 64 Crete 5.4 Welter-Schultes
& Wiese, 1997c
28. Chrisí Crete 5.08 0.50 12 8 1 27 Crete 14.0 Welter-Schultes
& Wiese, 1997b
29. Páno
Koufonísi Kikládes 6.00 0.0 9 8 114 Náxos 3.7 Mylonas,
1982
30. Día Crete 12.5 12.5 21 18 1 268 Crete 12.0 Schultes
& Wiese, 1990; Vardinoyannis, 1994
31. Kéros Kikládes 15.5 0.0 14 14 432 Náxos 8.2 Mylonas,
1982
32. Políegos Kikládes 17.2 0.0 11 9 370 Mílos 5.5 Mylonas,
1982
33. Irakliá Kikládes 17.6 0.0 18 13 419 Náxos 4.5 Mylonas,
1982
34. Makrónisos Kikládes 18.3 0.0 19 17 264 Greece 2.4 Mylonas
& Vardinoyannis, 1989
35. Andikíthira S.Aegean 20.0 20.0 25 20 1 378 Crete 35.5 Vardinoyannis,
1994
36. Saría S.Aegean 21.1 21.1 20 17 1 629 Kárpathos 0.60 Vardinoyannis,
1994
37. Gávdos Crete 26.8 25.6 27 20 1 345 Crete 35.8 Welter-Schultes,
1998b
38. Folégandros Kikládes 32.1 19.8 28 21 415 Ios 26.5 Mylonas,
1982
39. Andíparos Kikládes 34.9 16.4 24 15 368 Páros 1.2 Mylonas,
1982
40. Kímolos Kikládes 35.7 0.0 20 12 358 Mílos 0.8 Mylonas,
1982
41. Anáfi Kikládes 38.4 20.9 22 17 582 Náxos 61 Mylonas,
1982
42. Sikinos Kikládes 41.0 23.9 29 20 533 Náxos 31 Mylonas,
1982
43. Léros Dodek. 53 13.2 40 33 328 Turkey 29 Reischütz,
1985
44. Kásos S.Aegean 66.0 66.0 24 19 1 601 Kárpathos 4.2 Vardinoyannis,
1994
45. Sífnos Kikládes 73.2 43.7 33 24 678 Náxos 52 Mylonas,
1982
46. Sérifos Kikládes 73.2 26.8 25 19 585 Greece 64 Mylonas,
1982
47. Thíra Kikládes 75.8 5.9 20 17 586 Náxos 42 Mylonas,
1982
48. Síros Kikládes 83.6 0.0 35 25 422 Andros 19 Mylonas,
1982
49. Míkonos Kikládes 85.5 0.0 15 10 372 Tínos 7.3 Mylonas,
1982
50. Kíthnos Kikládes 99.3 15.2 25 20 306 Greece 39.5 Mylonas,
1982
51. Ios Kikládes 107.8 19 22 17 713 Náxos 17 Mylonas,
1982
52. Amorgós Kikládes 121.1 0.0 31 28 821 Náxos 23.5 Mylonas,
1982
53. Kéa Kikládes 130.6 0.0 34 27 560 Greece 20.5 Mylonas,
1982
54. Mílos Kikládes 150.6 0.0 26 17 751 Greece 99.5 Mylonas,
1982
55. Tínos Kikládes 194.3 0.0 36 29 730 Evia 52.5 Mylonas,
1982
56. Páros Kikládes 194.5 104.0 36 26 705 Greece 113 Mylonas,
1982
57. Kíthira S.Aegean 278 53.6 49 37 3 506 Greece 12.8 Vardinoyannis,
1994
58. Kárpathos S.Aegean 301 179.6 48 36 2 1215 Ródos 47 Vardinoyannis,
1994
59. Andros Kikládes 380 102.3 38 29 994 Evia 14.8 Mylonas,
1982
60. Náxos Kikládes 428 240 42 33 1001 Turkey 126 Mylonas,
1982
61. Límnos N.Aegean 460 0.0 34 22 459 Turkey 58.5 Reischütz,
1986
62. Chíos N.Aegean 842 556 50 43 1297 Turkey 5.5 Bar
& Butot, 1986
63. Ródos Dodek. 1400 350 60 50 5 1215 Turkey 16.5 Vardinoyannis,
1994
64. Lésvos N.Aegean 1630 0.0 52 43 968 Turkey 9.8 Bank,
1988
65. Crete S.Aegean 8260 6380 135 120 5-14? 2456 Greece 101 F.
Welter-Schultes, unpubl. data
Corsica W.
Medit. 8723 1841 85 77 2707 Italy 81 Piantelli
et al., 1990
Sardinia W.
Medit. 24090 3375 98 88 1829 Italy 188 Manganelli
et al., 1995; Bodon et al
., 1995
Sicily W.
Medit. 25710 19330 132 122 3323 Italy 4.0 Manganelli
et al., 1995; Bodon et al., 1995
Albania 2.9x10⁴ 230 Dhora
& Welter-Schultes, 1996
Former
Yugoslavia 2.5x10⁵ 550 F.
Welter-Schultes, unpubl. data
Europe 1.0x10⁷ 1370 Falkner,
1990
A = area (total), Acal = calcareous area, S = species (total),
Saut = autochthonous species, SEn = Enidae species, NCLI = nearest considerably
larger island (or territory), D = distance to NCLI.
Table 2. Goodness-of-fit statistics and probability (p-) values associated with each variable at each step in the stepwise regression model construction, using both the power and extreme-value function models. The univariate R2 or R2-like statistics show the strength of association between log(species number) [power function model] or species number [EVF model] and each variable alone. Each column of p-values is for the remaining variables, after fitting the variable heading the column to the regression model. Variables that will most improve the model fit have the lowest p-values. At the base of each column is the R2 or R2-like goodness-of-fit statistic for the model after fitting the variable heading 7the column.
Power
function model Extreme-value
function model
Parameter Univariate R2 statistic and
associated p-value
P-values associated with each parameter after fitting effects for:
Univariate R2-like statistic and associated p-value
P-values associated with each parameter after
fitting effects for:
log(area)Elevation log(area)Elevation PCS log(area)
Elevation PCS log(area) log(area)Elevation log(area) Elevation
log(area) 0.82(<0.0001) - - - 0.82(<0.0001) - - -
Elevation 0.77(<0.0001) 2E-7 - - 0.84(<0.0001) 1E-17 - -
PCS 0.16(0.00080) 0.00028 0.015 - 0.071(<0.0001) 2E-11 0.053 -
Distance 0.35(<0.0001) 0.11 0.85 0.96 0.33(<0.0001) 0.014 0.75 0.64
Calcareous substrate present 0.010(0.43) 0.0015 0.021 0.48 0.00012(0.77) 3E-6 0.11 0.74
All calcareous substrate 0.40(<0.0001) 0.049 0.091 0.62 0.33(<0.0001) 3E-5 0.17 0.99
Partially calcareous substrate 0.34(<0.0001) 0.089 0.32 0.47 0.32(<0.0001) 0.031 0.50 0.81
R2 or R2-like statistic - 0.82 0.89 0.90 - 0.82 0.93 0.93
PCS = proportion of calcareous substrate.
Table 3. Parameter estimates (top line) and associated standard errors for various regression models. Log(species number) [power function model] or species number [EVF model] was regressed on the variables heading each column.
Power function model Extreme-value
function model
Variable log(area) log(area)Elevation log(area)ElevationPCS log(area) log(area)Elevation log(area)ElevationPCS
Intercept 0.98//0.019 0.92//0.019 0.85//0.030 -3.44//0.055 -3.44//0.050 -3.57//0.084
log(area) 0.180.011 0.120.015 0.150.018 0.570.025 0.290.038 0.360.052
Elevation - 0.00030//0.000052 0.00025//0.000053 -
0.00072//0.000077 0.00060//0.000098
PCS -
- 0.099//0.039 - - 0.20//0.10
PCS = proportion of calcareous substrate.
Figures
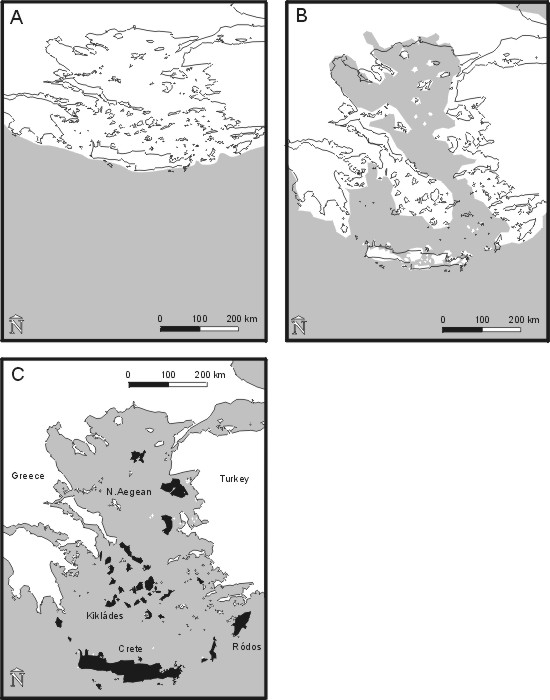
Fig. 1. Paleogeography of the Aegean (A) in the middle Miocene (Langhian, 16.5 Ma), (B) during the late Miocene (Messinian, 6.5 Ma), and (C) the present geography in the Aegean, the 65 islands dealt with in this study are shown in black.

Fig. 2. Species-area relation for autochthonous land snails of the Aegean islands (closed circles). The western Mediterranean islands (open circles) and the values for continental areas (AL = Albania, FYU = Former Yugoslavia) are shown for comparison and were not included in the analyses. Regression lines are as follows: power function (dashed line, logS = 0.977 + 0.184 logA, R2 = 0.82); power function, fitted using non-linear regression (dotted line, S = 4.626 A0.344, R2 = 0.88, continental values also excluded here); extreme-value function (solid line, S = 264 (1-exp (-exp (0.572 logA-3.444))), R2-like = 0.82). Non-linear regression gives the worst fit.
muell@schrottmails.de hier klicken